Automated Output

Daily Charts

A daily market snapshot from my trendline program: a fixed set of index charts every session, plus any bounce candidates that meet criteria that day. This is program output, not investment advice.

Last generated: 2026-07-20 22:49 UTC · 5 index · 0 bounce candidates

DIASPDR Dow Jones Industrial Average ETF Trust
Support · Close-fit
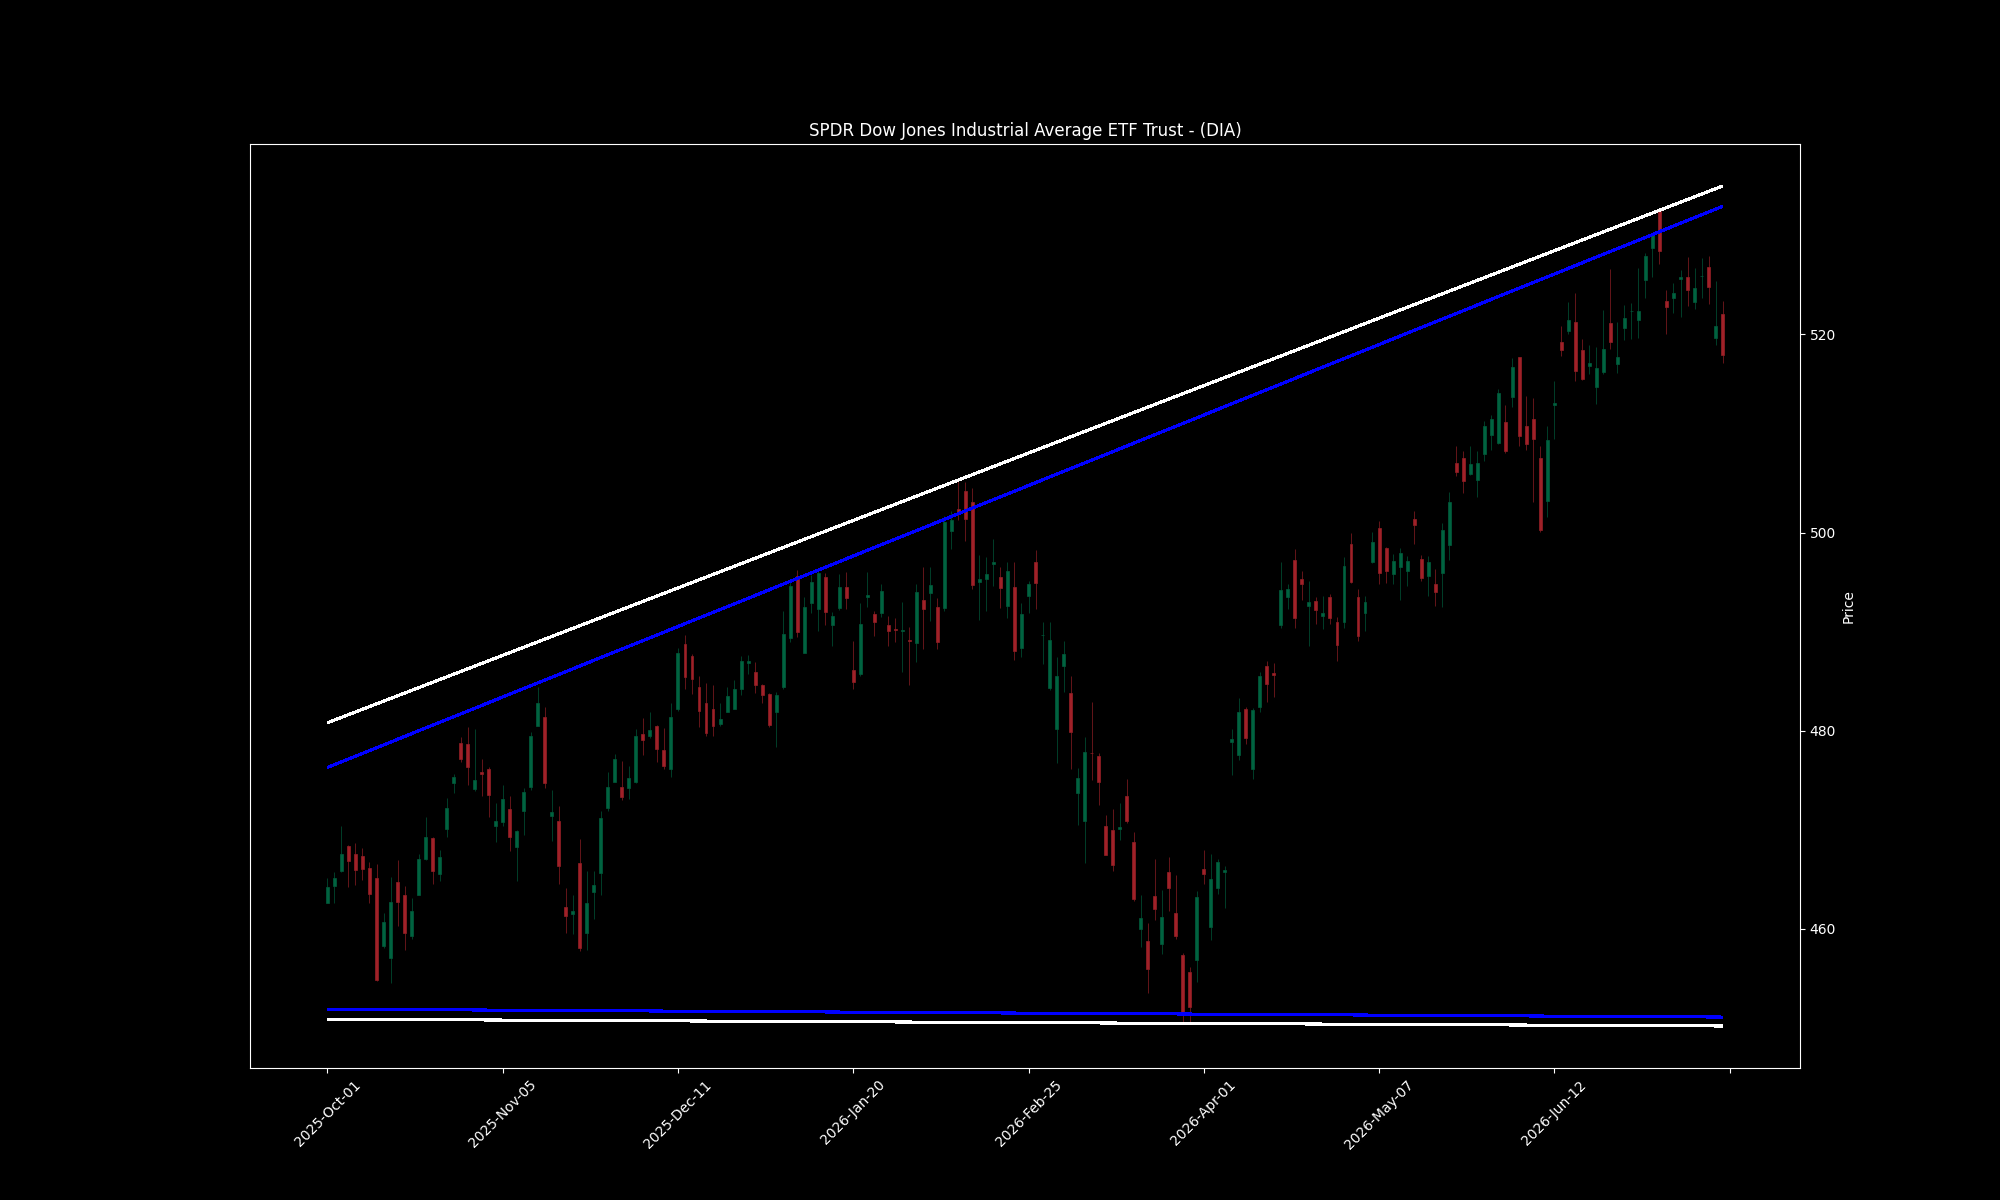
DIA daily chart with fitted trendline channel
Recent volatility6.63
Long-term volatility7.21
S/R intersection2025-06-16 at 452.22
Fib levels516.13, 513.1, 510.07, 505.75
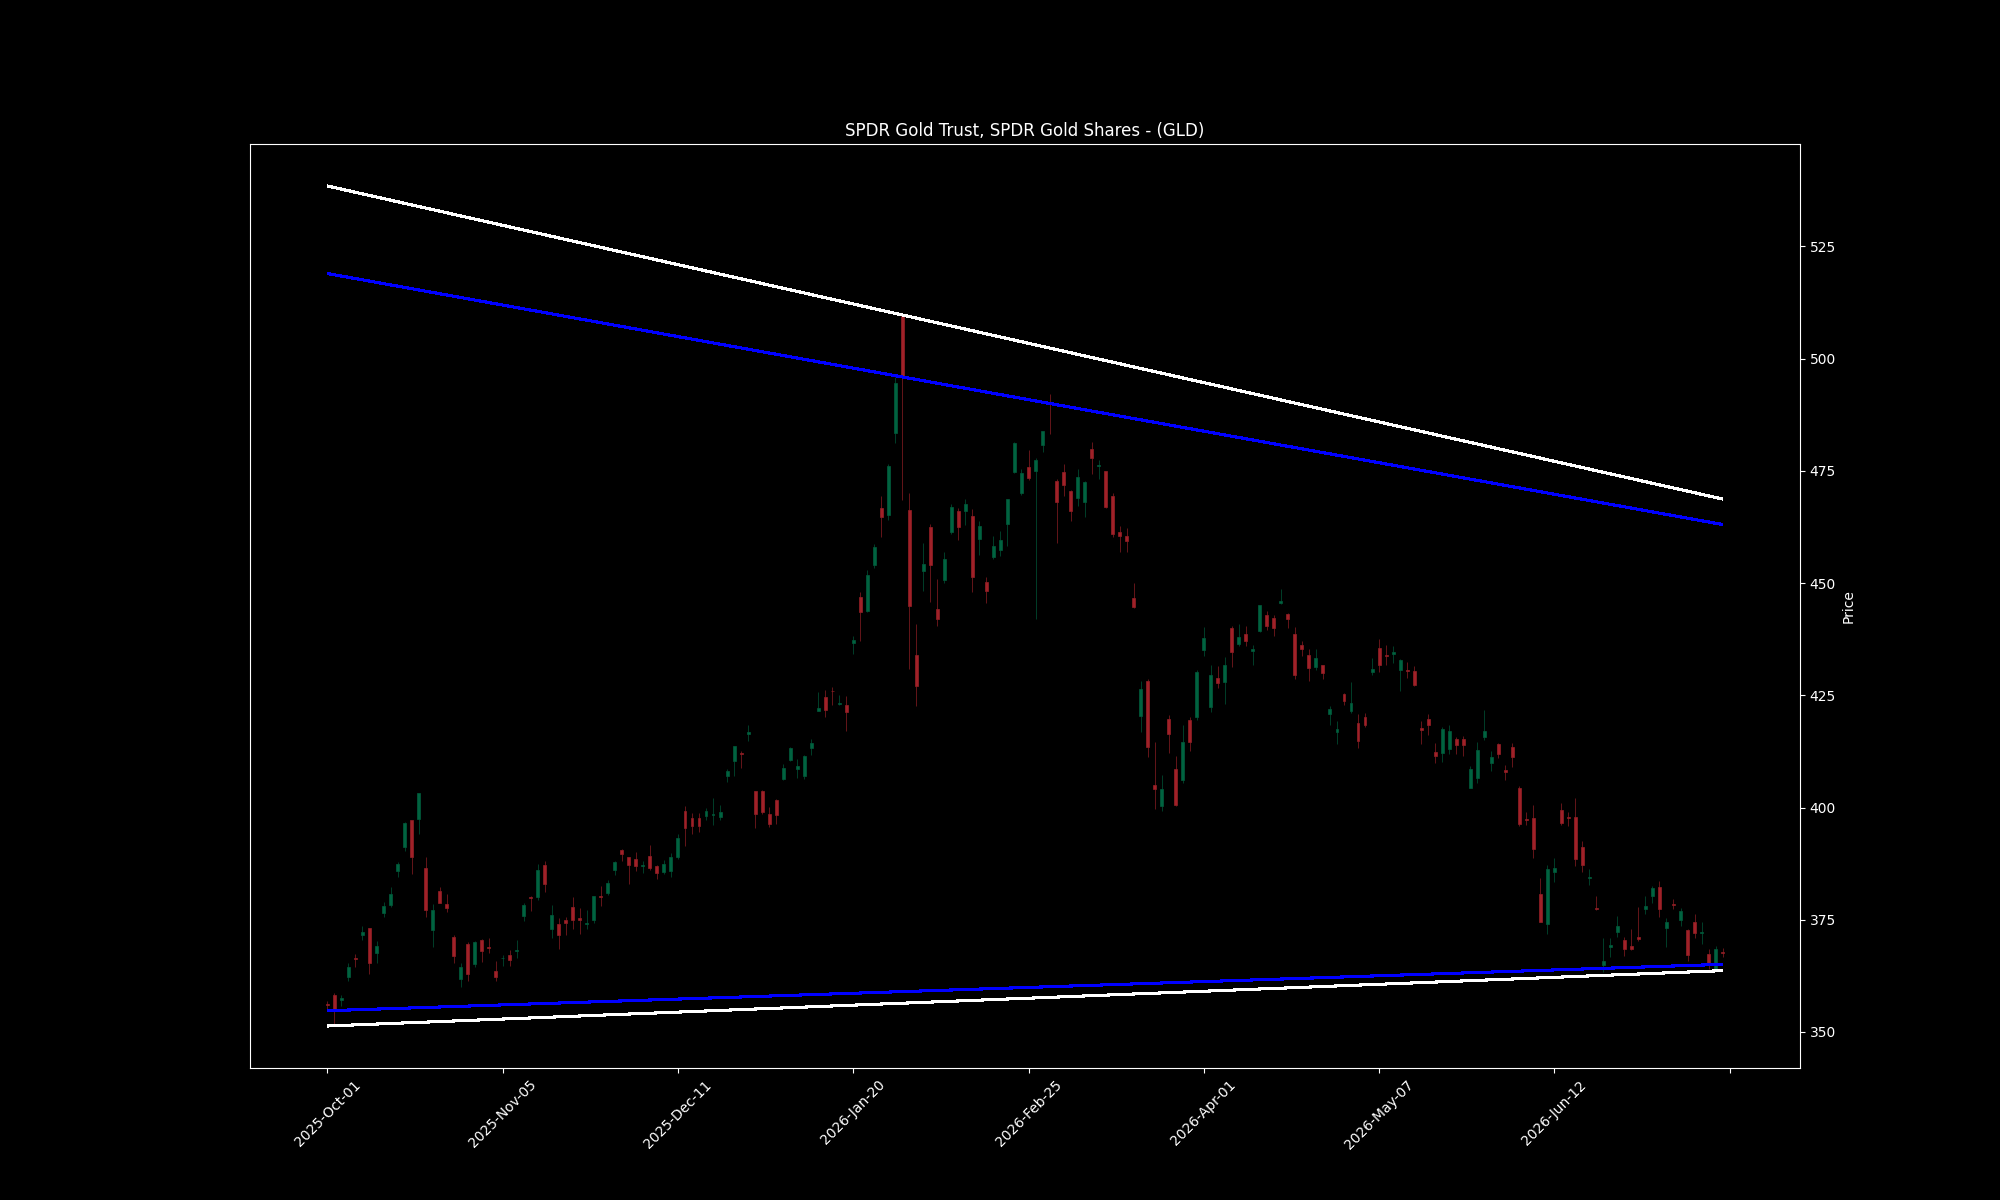
GLDSPDR Gold Trust, SPDR Gold Shares
Support · Close-fit
GLD daily chart with fitted trendline channel
Recent volatility8.01
Long-term volatility11.38
S/R intersection2027-09-02 at 380.34
Fib levels375.94, 374.02, 372.11, 369.39
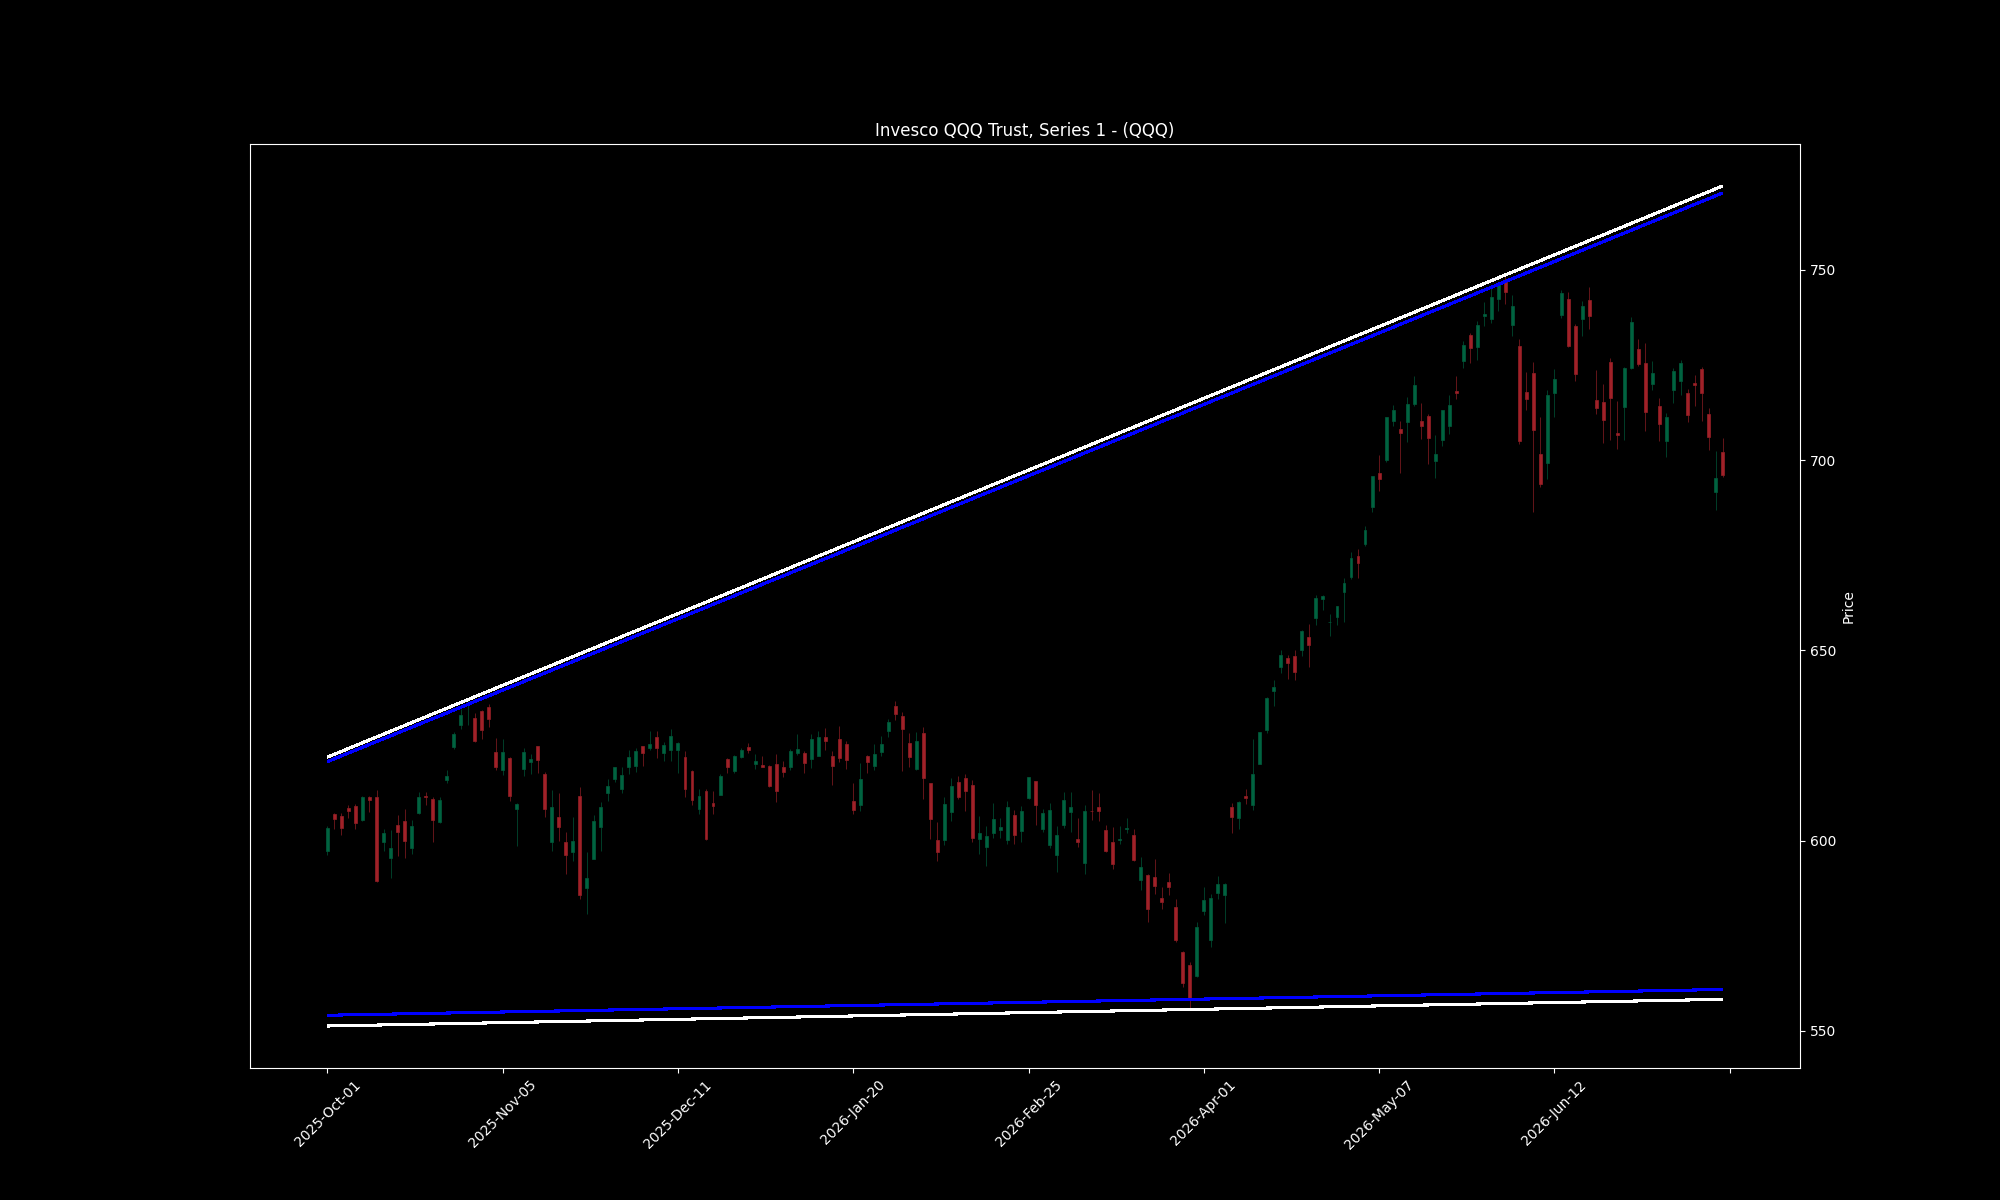
QQQInvesco QQQ Trust, Series 1
Support · Close-fit
QQQ daily chart with fitted trendline channel
Recent volatility17.55
Long-term volatility13.92
S/R intersection2025-06-04 at 550.94
Fib levels719.37, 717.47, 715.57, 712.87
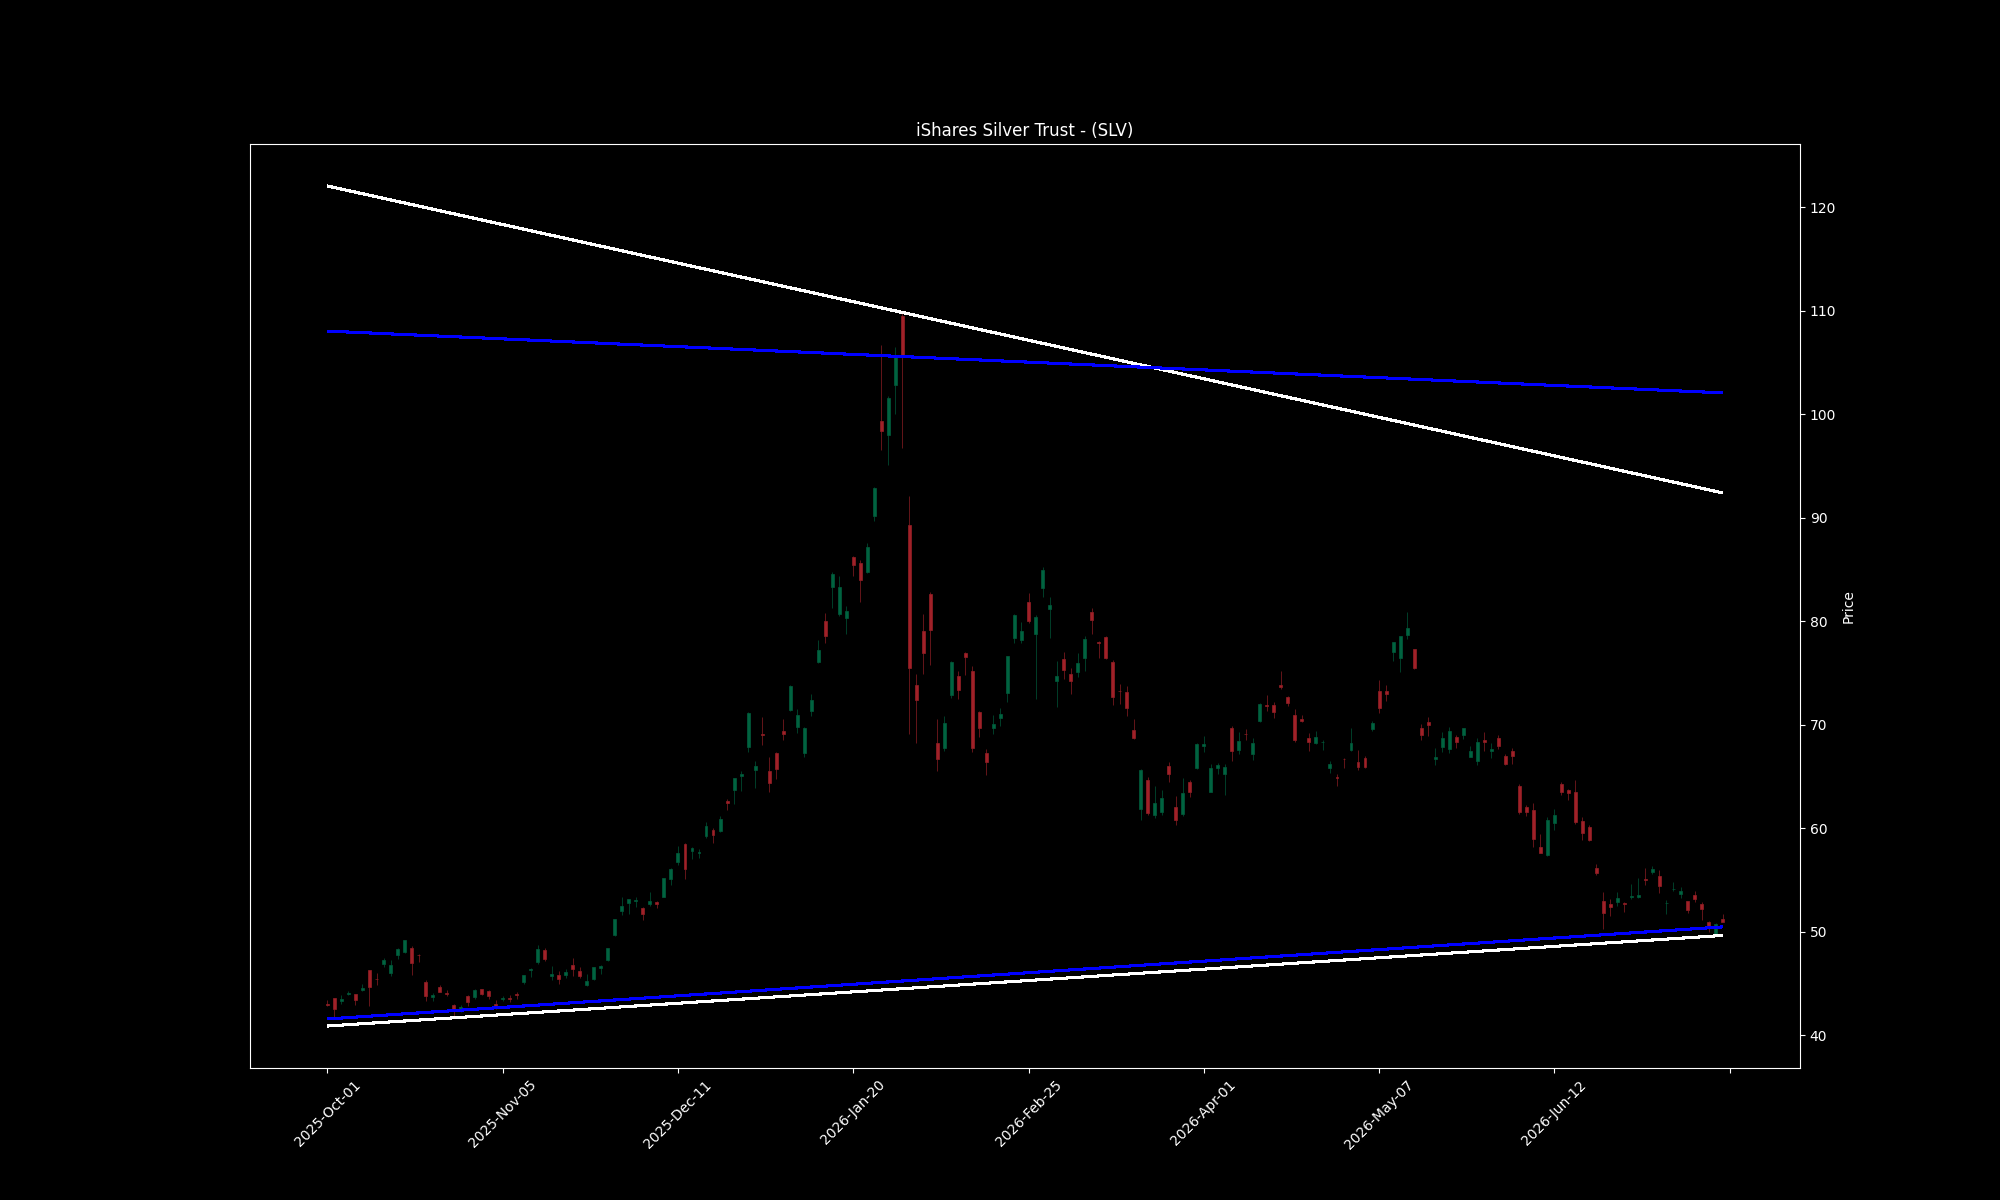
SLViShares Silver Trust
Support · Close-fit
SLV daily chart with fitted trendline channel
Recent volatility2.18
Long-term volatility4.17
S/R intersection2029-03-12 at 81.35
Fib levels54.46, 53.94, 53.43, 52.71
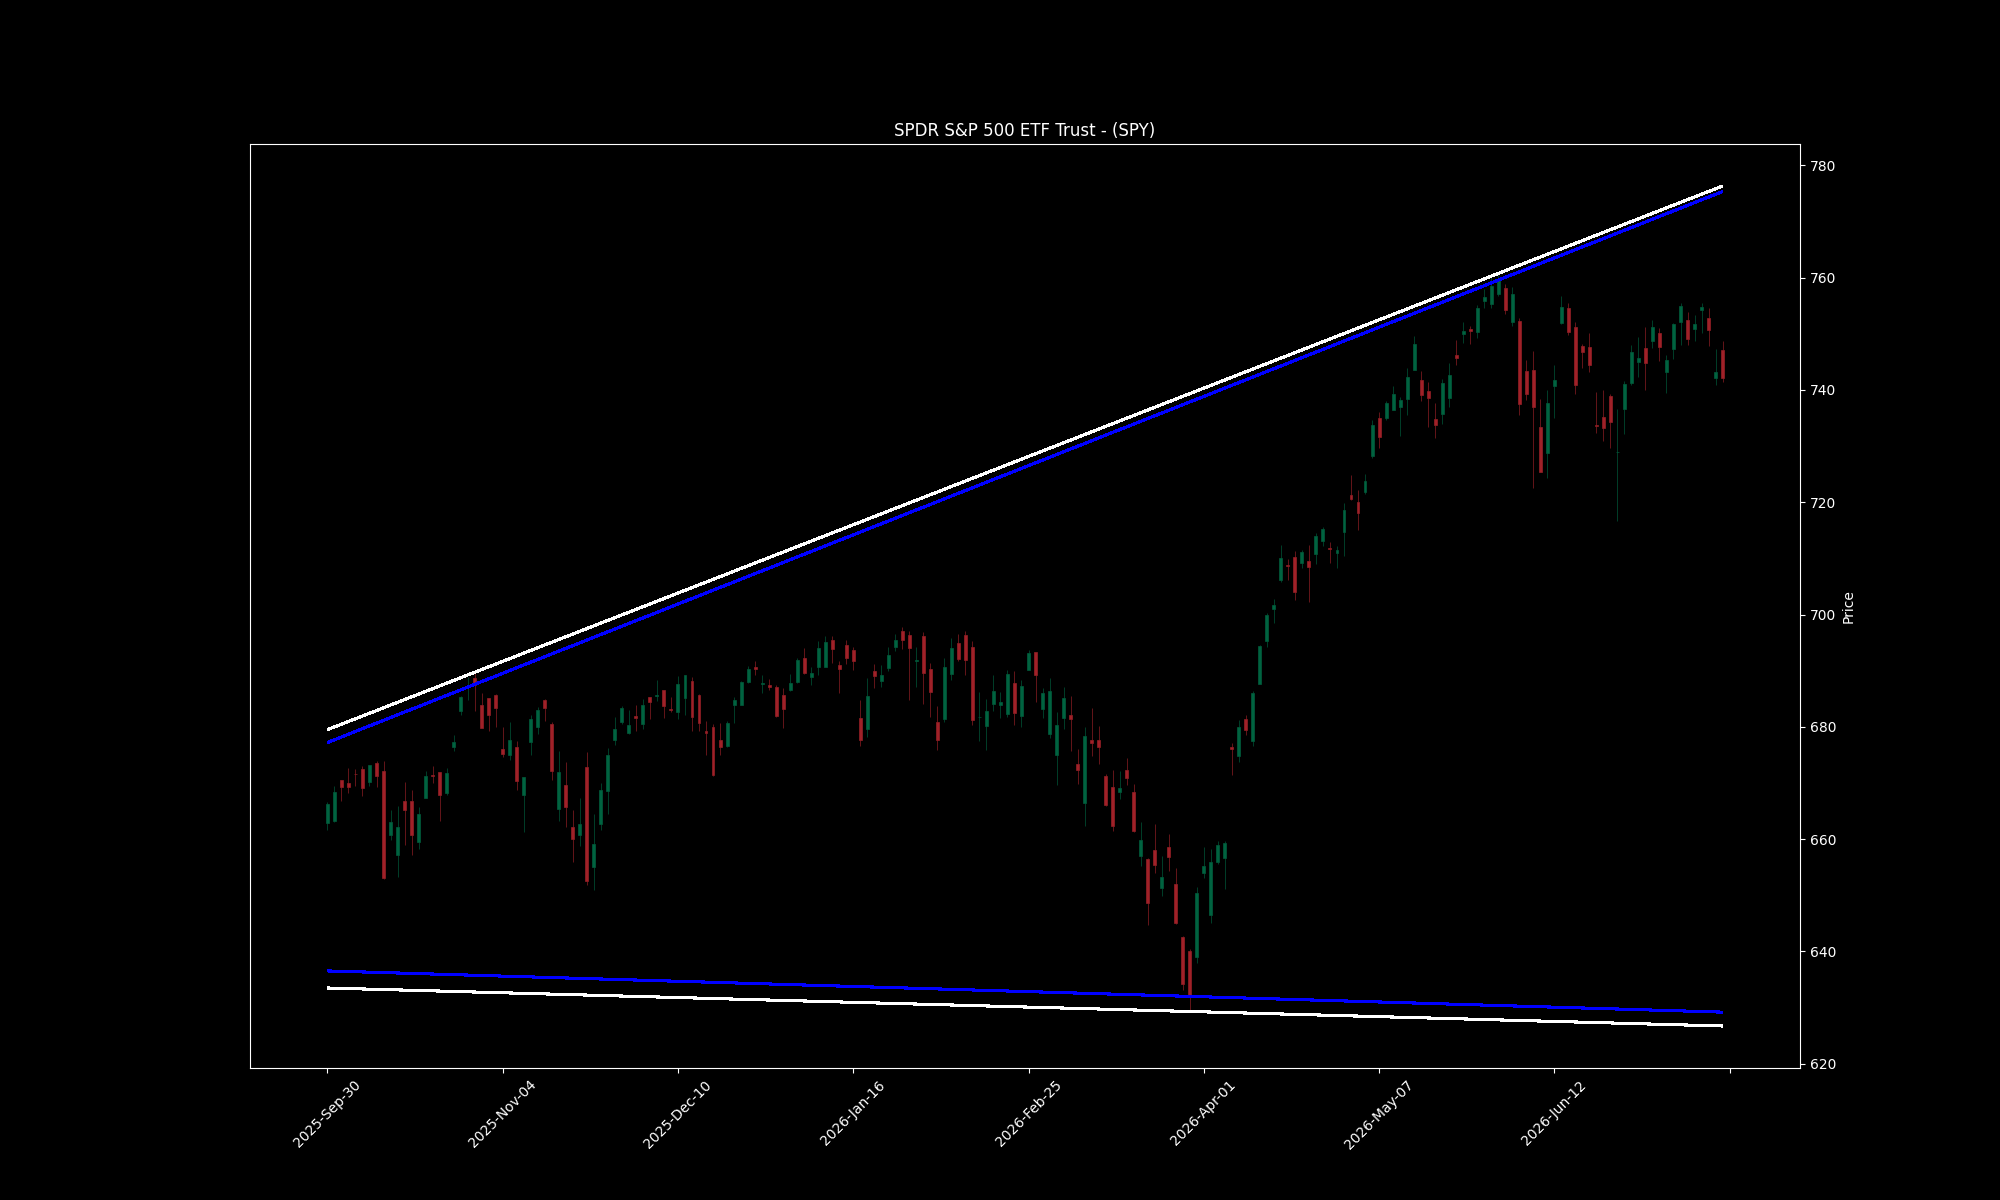
SPYSPDR S&P 500 ETF Trust
Support · Close-fit
SPY daily chart with fitted trendline channel
Recent volatility9.26
Long-term volatility13.65
S/R intersection2025-06-25 at 639.93
Fib levels745.03, 741.97, 738.91, 734.55

No bounce candidates met criteria today. The index snapshot above reflects the broader session.